
Review of Business and Economics Studies, 2014, том 2, № 2
Покупка
Основная коллекция
Тематика:
Экономика. Бухгалтерский учет. Финансы
Наименование: Review of Business and Economics Studies
Год издания: 2014
Кол-во страниц: 80
Дополнительно
Вид издания:
Журнал
Артикул: 705310.0001.99
Тематика:
ББК:
УДК:
ГРНТИ:
Скопировать запись
Фрагмент текстового слоя документа размещен для индексирующих роботов.
Для полноценной работы с документом, пожалуйста, перейдите в
ридер.
Review of
Business and
Economics
Studies

EDITOR-IN-CHIEF
Prof. Alexander Ilyinsky
Dean, International Finance Faculty,
Financial University, Moscow, Russia
ailyinsky@fa.ru

EXECUTIVE EDITOR
Dr. Alexander Kaffka

EDITORIAL BOARD

Dr. Mark Aleksanyan
Adam Smith Business School,
The Business School, University
of Glasgow, UK

Prof. Edoardo Croci
Research Director, IEFE Centre for
Research on Energy and Environmental
Economics and Policy, Università
Bocconi, Italy

Prof. Moorad Choudhry
Dept.of Mathematical Sciences, Brunel
University, UK

Prof. David Dickinson
Department of Economics, Birmingham
Business School, University of
Birmingham, UK

Prof. Chien-Te Fan
Institute of Law for Science and
Technology, National Tsing Hua
University, Taiwan

Prof. Wing M. Fok
Director, Asia Business Studies, College
of Business, Loyola University New
Orleans, USA

Prof. Konstantin P. Gluschenko
Faculty of Economics, Novosibirsk State
University, Russia

Prof. George E. Halkos
Associate Editor in Environment and
Development Economics, Cambridge
University Press; Director of Operations
Research Laboratory, University of
Thessaly, Greece

Dr. Christopher A. Hartwell
President, CASE - Center for Social and
Economic Research, Warsaw, Poland

Prof. S. Jaimungal
Associate Chair of Graduate
Studies, Dept. Statistical Sciences
& Mathematical Finance Program,
University of Toronto, Canada

Prof. Bartlomiej Kaminski
University of Maryland, USA;

Rzeszow University of Information
Technology and Management,
Poland

Prof. Vladimir Kvint
Chair of Financial Strategy, Moscow
School of Economics, Moscow State
University, Russia

Prof. Alexander Melnikov
Department of Mathematical and
Statistical Sciences, University of
Alberta, Canada

Prof. George Kleiner
Deputy Director, Central Economics and
Mathematics Institute, Russian Academy
of Sciences, Russia

Prof. Kwok Kwong
Director, Asian Pacific Business
Institute, California State University, Los
Angeles, USA

Prof. Dimitrios Mavrakis
Director, Energy Policy and
Development Centre, National and
Kapodistrian University of Athens,
Greece

Prof. Steve McGuire
Director, Entrepreneurship Institute,
California State University, Los Angeles,
USA

Prof. Rustem Nureev
Head of the Department of
Macroeconomics, Financial University,
Russia

Dr. Oleg V. Pavlov
Associate Professor of Economics and
System Dynamics, Department of Social
Science and Policy Studies, Worcester
Polytechnic Institute, USA

Prof. Boris Porfiriev
Deputy Director, Institute of Economic
Forecasting, Russian Academy of
Sciences, Russia

Prof. Svetlozar T. Rachev
Professor of Finance, College of
Business, Stony Brook University, USA

Prof. Boris Rubtsov
Chair of Financial Markets and
Financial Engineering, Financial
University, Russia

Dr. Minghao Shen
Dean, Center for Cantonese Merchants
Research, Guangdong University of
Foreign Studies, China

Prof. Dmitry Sorokin
Deputy Director, Institute of Economy,
Russian Academy of Sciences, Head of
the Department of Macroeconomics
Regulation, Financial University, Russia

Prof. Robert L. Tang
Vice Chancellor for Academic, De La
Salle College of Saint Benilde, Manila,
The Philippines

Dr. Dimitrios Tsomocos
Saïd Business School, Fellow in
Management, University of Oxford;
Senior Research Associate, Financial
Markets Group, London School
of Economics, UK

Prof. Sun Xiaoqin
Dean, Graduate School of Business,
Guangdong University of Foreign
Studies, China

REVIEW OF BUSINESS
AND ECONOMICS STUDIES
(ROBES) is the quarterly peerreviewed scholarly journal published
by the Financial University under
the Government of Russian
Federation, Moscow. Journal’s
mission is to provide scientific
perspective on wide range of topical
economic and business subjects.

CONTACT INFORMATION
Financial University
Leningradskiy Av. 51 Building 3,
125993 Moscow
Russian Federation
Telephone: +7(499) 943-95-23
Website: www.robes.fa.ru

AUTHOR INQUIRIES
Inquiries relating to the
submission of articles can be sent
by electronic mail to robes@fa.ru.

COPYRIGHT AND PHOTOCOPYING
© 2014 Review of Business and
Economics Studies.  All rights
reserved. No part of this publication
may be reproduced, stored
or transmitted in any form or by any
means without the prior permission
in writing from the copyright holder.
Single photocopies of articles may
be made for personal use as allowed
by national copyright laws.
ISSN 2308-944X
Вестник
исследований
бизнеса и
экономики

ГЛАВНЫЙ РЕДАКТОР
А.И. Ильинский, профессор, декан
Международного финансо вого факультета Финансового университета

ВЫПУСКАЮЩИЙ РЕДАКТОР
А.В. Каффка

РЕДАКЦИОННЫЙ СОВЕТ

М. М. Алексанян, профессор Бизнесшколы им. Адама Смита, Университет
Глазго (Великобритания)

К. Вонг, профессор, директор Института азиатско-тихоокеанского бизнеса
Университета штата Калифорния,
Лос-Анджелес (США)

К. П. Глущенко, профессор Экономического факультета Новосибирского
госуниверситета

С. Джеимангал, профессор Департамента статистики и математических финансов Университета Торонто
(Канада)

Д. Дикинсон, профессор Департамента экономики Бирмингемской бизнесшколы, Бирмингемский университет
(Великобритания)

Б. Каминский, профессор,
Мэрилендский университет (США);
Университет информационных
технологий и менеджмента в Жешове
(Польша)

В. Л. Квинт, заведующий кафедрой
финансовой стратегии Московской
школы экономики МГУ, профессор
Школы бизнеса Лассальского университета (США)

Г. Б. Клейнер, профессор, член-корреспондент РАН, заместитель директора Центрального экономико-математического института РАН

Э. Крочи, профессор, директор по
научной работе Центра исследований
в области энергетики и экономики
окружающей среды Университета
Боккони (Италия)

Д. Мавракис, профессор, директор
Центра политики и развития энергетики Национального университета
Афин (Греция)

С. Макгвайр, профессор, директор
Института предпринимательства
Университета штата Калифорния,
Лос-Анджелес (США)

А. Мельников, профессор Департа мента математических и статистических исследований
Университета провинции Альберта
(Канада)

Р. М. Нуреев, профессор, заведующий кафедрой «Макроэкономика»
Финансового университета

О. В. Павлов, профессор Депар тамента по литологии и полити ческих
исследований Ворчестерского
политехнического института (США)

Б. Н. Порфирьев, профессор,
член-корреспондент РАН, заместитель директора Института
народнохозяйственного прогнозирования РАН

С. Рачев, профессор Бизнес-колледжа Университета Стони Брук (США)

Б. Б. Рубцов, профессор, заведующий кафедрой «Финансовые рынки
и финансовый инжиниринг» Финансового университета

Д. Е. Сорокин, профессор,
член-корреспондент РАН,
заместитель директора Института
экономики РАН, заведующий
кафедрой «Макроэкономическое
регулирование» Финансового
университета

Р. Тан, профессор, проректор
Колледжа Де Ла Саль Св. Бенильды
(Филиппины)

Д. Тсомокос, Оксфордский университет, старший научный сотрудник
Лондонской школы экономики (Великобритания)

Ч. Т. Фан, профессор, Институт
права в области науки и технологии,
национальный университет Цин Хуа
(Тайвань)

В. Фок, профессор, директор по
исследованиям азиатского бизнеса
Бизнес-колледжа Университета Лойола (США)

Д. Е. Халкос, профессор, Университет Фессалии (Греция)

К. А. Хартвелл, президент Центра
социальных и экономических исследований CASE (Польша)

М. Чудри, профессор, Университет
Брунеля (Великобритания)

Сун Цяокин, профессор, декан Высшей школы бизнеса Гуандунского
университета зарубежных исследований (КНР)

М. Шен, декан Центра кантонских
рыночных исследований Гуандунского университета (КНР)

Издательство Финансового
университета
125993, Москва, ГСП-3,
Ленинградский проспект, 51,
корп. 3, к. 104.
Тел. 8 (499) 943-95-23.
Интернет: www.robes.fa.ru.

Журнал «Review of Business and
Economics Studies» («Вест ник
исследований бизнеса и экономики») зарегистрирован
в Федеральной службе по надзору в сфере связи, информационных технологий и массовых
коммуникаций 9 июля 2013 г.
Свидетельство о регистрации
ПИ № ФС77-54658.

Подписано в печать: 26.06.2014.
Формат 60 × 84 1/8.
Заказ № 82 от 27.06.2014.
Отпечатано в ООП Издательства
Финуниверситета (Настасьинский пер., д. 3, стр. 1).
16+
CONTENTS

Effect of Income on Political Preferences of Russian voters

Rustem Nureev, Sergey Shulgin 5

The Lessons from the Insistence of the U.S.A. in Nuclear Energy Policy

Wen-Hsiang Kung  28

Recent Development of New Energy Policy and Legislation in Taiwan, with the

Focus on Promotion of Biofuel

Yueh-Hsun Tsai 42

Priority Issues for Boosting Smart Grid-Smart Customers in Taiwan

Wen-Ling Sun 51

“Social Impact Bonds”: Implications for Government and Non-Profit

Organizations

Antonio Costa, Paolo Leoci, Alessandra Tafuro 58

Social Media’s Role in Intellectual Capital’s Growth

Michał Falkowski 66

The Need to Design a Quality System for Macedonian Textile Companies

Elizabeta Mitreva, Nako Taskov  75

Review of
Business and
Economics
Studies

Volume 2, Number 2, 2014
CОДЕРЖАНИЕ

Влияние уровня доходов на политические предпочтения российских

избирателей

Рустем Нуреев, Сергей Шульгин 5

Использование опыта США при формировании политики в области атомной

энергетики

Вень-Сянь Кунь  28

Новая энергетическая политика и законодательство Тайваня, направленные

на внедрение биотоплива

Юэ-Сунь Цай 42

Приоритетные вопросы развития «умных сетей электроснабжения» в Тайване

Вэнь-Линь Сунь 51

«Социальные облигации» и их применение в государственных

и некоммерческих организациях

Антонио Коста, Паоло Леучи, Алессандра Тафуро 58

Роль социальных медиа в увеличении интеллектуального капитала

Михал Фальковский 66

Создание системы обеспечения качества для текстильных компаний

Македонии

Элизабета Митрева, Нако Тасков   75

Вестник
исследований
бизнеса и
экономики

№ 2, 2014
Review of Business and Economics Studies

Volume 2, Number 2, 2014

Effect of Income on Political Preferences
of Russian Voters*

Rustem NUREEV, Doctor of economics, Professor
Head of Macroeconomics Department, Financial University; Professor at National Research University — Higher School
of Economics, Moscow
nureev50@gmail.com

Sergey ShUlgiN, Ph.D. in economics
Russian Academy for National Economy and Public Administration (RANEPA), Moscow
sergey@shulgin.ru

Abstract. There was direct correlation between the voters’ income and electoral support for incumbent in
Russia during the 1990-s and early 2000-s. The results of election to the State Duma (the parliament) in 2011
and Russia’s presidential elections in 2012 show the opposite. Using income data and electoral results in the
Russian regions for each candidate (G. Zyuganov, S. Mironov, V. Zhirinovsky, M. Prokhorov, V. Putin) we defined the
level of electoral support in different income groups. Results show the substantial changes in last 8 years in
voting behavior. There is the effect of Putin’s inversed threshold and the greatest proportion of votes negatively
correlated (–1.58), with a group of people with incomes of 14,250 to 21,250 rub/month. Such inverse correlation
may be due to a protest voting. Putin’s electoral support has a positive correlation in low-income group. In this
paper we analyze the determinants of voting behavior and show how the income distribution affects the voters’
political preferences (based on the results of the presidential elections in 2012). For each candidate we defined
the level of electoral support in different income groups. Also we analyzed income distribution of absent voters.

Аннотация. В статье анализируются детерминанты электорального поведения и показывается, каким
образом распределение населения по доходам влияет на политические предпочтения избирателей
(по итогам федеральных выборов 2012 г.) Определен пороговый уровень доходов, при достижении которого
люди начинают проявлять социальную активность и заинтересованность в участии в электоральной
системе (демократии). Показано влияние распределения доходов в российских регионах на политические
предпочтения избирателей.

Key words: Political preferences, regional studies, electoral behavior, income distribution.

* Влияние уровня доходов на политические предпочтения российских избирателей.

1. REVIEw

S. Kuznets was the one of the first who showed the importance of the distribution of income inequality for
economic growth and social and economic progress
(Kuznets, 1955; 1971; 1979). However, the focus of his
research was not the problem of electoral behavior of
voters. Almost ten years later, it becomes the subject
of a special study (Lewis-Beck, 1988). Analyzing the
Western democracies, the author suggested indirect,
but reliable way to assess the economic factors on the
electoral process. The book summarizes and complements the classical set of economic factors to explain
the behavior of voters. M. Lewis-Beck believes that the
majority of voters rarely appeal to the main macroeco
nomic indicators in assessing the economic situation
and prospects of the economy.
According to M. Lewis-Beck, changes in voters’ disposable income also have minor effects on electoral
behavior. This paradox can be partly explained by
the weak faith of the population in the government’s
ability to influence the personal financial situation
(by arguments like: “The economic policy of the government matters, but does not affect me”). According to sociological researches in 1980-s, influence of
government policy on personal well-being was felt by
only 45% of population in UK, 44% in France, 40% in
Germany, 34% in Italy, 49% in Spain, and only 20% in
USA. Lewis-Beck uses his survey to show that in almost
all the developed capitalist countries, the economic
Review of Business and Economics Studies

Volume 2, Number 2, 2014

reasons are the most important in the vote. The motives of party self-identification (right/left in Europe,
the Republicans/Democrats in the U.S.), appear much
stronger than the motives of social or religious identity.
The following factors strengthen the economic value of
vote: the openness of the national economy, economic
growth or its expectation, the presence of the ruling
coalition or single party government. Among the developed countries studied by Lewis-Beck, the economic
motives of the electoral behavior are mostly significant
in the United States. In any case, the economic motive
affects voting through the personal assessment of the
economic development of the country’s voters.
For assessment Lewis-Beck suggests three components: “Retrospective” (evaluation of the past compared to the present), “Prospective” (assessment of the
future) and “Affective” (unexplained irritation, etc.).
According to his study, the most important is “Prospective” evaluation of public policies, the second — “affective” component and the last — “retrospective” component of assessment.
Respondents were asked to rate the influence of
the government on unemployment, inflation, personal well-being, balance of trade, economic growth,
public debt and a number of other parameters. Unemployment was the most important parameter in
all countries (UK, France, Germany, Italy, Spain) and
inflation was on the second place. Other parameters
(such as personal well-being, balance of trade, economic growth, public debt, etc.) were significantly less
important than unemployment and inflation. We can
see from Lewis-Beck that voters in Western democracies assess their economic situation and current trends
primarily through their assessment of the future.
According to R. Kiewiet and D. Rivers (1984) voters are not inclined to attach great importance to the
current macroeconomic situation. Authors believed
that voters were rather farsighted than myopic, and
votes do not tend to react with enthusiasm for the
short-time economic improvement. Voters do not
live by one day and are able to assess the dynamics of
the economic situation. The authors in their studies
used “Eurobarometer” data by George Gallup Institute.
The authors suggested that economic motives of voting were particularly strong in the case of deterioration of the situation. Growth of economic indicators,
as it turned out, did not lead to a significant increase
of electoral support for incumbent. Economic growth
matters only in case of a sharp change of direction in
economic development (the typical example — Ronald
Reagan’s victory in the presidential election in 1984).
A. Sobyanin and B. Suhovolskiy (1995) studied the
electoral process in Russia and demonstrated numerous examples of electoral frauds using electoral sta
tistics. According to A. Lavrov (1997) social structure
affects voters’ political preferences. Lavrov argued that
the higher share of urban population and share of population employed by the government (in public administration and state industry) and the share of people
with tertiary education lead to the stronger electoral
support for centrist and democratic candidates. And
vice versa, support for the left politicians in 1990-s increased with a higher share of rural and agrarian population and with higher share of pensioners.
L. Smirnayagin (1999) studied the stability of political preferences and proposed a “degradation index”,
to explain the shifts in voters’ political preferences.
He estimated degradation index for Russia in 1990-s
as 0.54. This means that 54% of the voters were ready
to change their political preferences in the next election. This high percentage of voters who were ready to
switch their preference means that formation of civil
society in Russia is uncompleted.
V. Mau, O. Kochetkova, K. Yanovsky, S. Zhavoronkov,
Yu. Lomakina (2000) studied the impact of different
economics indications on electoral behavior. They argued that in late 90-s (1995–2000) the most important
for electoral behavior were income and wages, tax payments, share of urban population. At that period the
higher was the voters’ income (wages etc.) the higher
was support for ruling party. The similar findings were
in later studies by O. Kochetkova (2004), according to
which the support for incumbent politicians positively
correlated with incomes and negatively correlated with
unemployment and wage arrears.
U. Seresova (2005) agued that economic indicators
were significant for the electoral process but were not
the most important ones. She suggested that electoral
behavior was better explained by the level of regional
modernization and the role of traditional culture.
However, most of studies analyzed the situation of
the electoral behavior of the 1990-s and early twentyfirst century. In this paper we deal with a new political
reality. In this article we further develop the approach
suggested by S. Shulgin (2005) who examined how income distribution in different countries affected democratic institutions. Author used income distribution
to analyze the levels of freedom of press measured by
Freedom House.

2. DATA

In this paper we use official Russia’s electoral statistics
for presidential election 2012. All our findings consequently contain errors associated with reliability of official electoral statistics. There is an extensive literature
that indicated the frauds during Russian elections. We
discussed this problem in several articles (Economic Sub
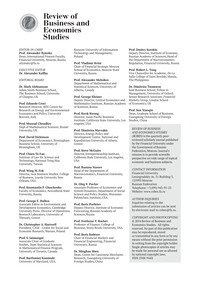
Review of Business and Economics Studies

Volume 2, Number 2, 2014

jects, 2010, etc.). The article (Enikolopov et al., 2013) discusses the results of the parliamentary elections in 2011.
Authors compared election results in Moscow precincts
attended by independent observers, with the election
results in precinct where observers were not allowed.
The second part of our data describes income levels
and income distributions in Russian regions. This statistics come from Russian Statistical Agency (RusStat).
RusStat estimates income distribution based on data
from the Household Budget Survey (HBS). Household
Budget Survey was carried out by state statistics on a
regular basis in all regions of the Russian Federation.
The unit of observation in this survey is the household
and its members.

3. DATA ANAlySIS

Using statistics on income level and income distribution, for each region we construct income distribution
function. Income distribution function for given level
of income evaluates the share of people within region
who have such level of income.
RusStat’s statistical yearbook “Regions of Russia”
(Regiony Rossii, 2011) in Table 5.9 gives the distribution of population by per capita income (as a share of
regional population). Table 5.8 (from yearbook) gives
the share of total income by 20 per cent population
groups (from the poorest 20% of population to the
richest 20% of population).
We use data on income distribution and per capita
income level to construct cumulative function that
shows how many people has income below a certain
value. For example, in the Belgorod region 4.2% of
people have incomes of up to 3,500 rubles, 6.3% from
3 500 to 5 000 rubles, 10.6% from 5 000 to 7 000 rubles, 16.2% from 7 000 to 10000, 21.4% from 10 000 to
15 000, 23.0% from 15 000 to 25 000, 9.5% from 25 000
to 35 000 and 8.8% of disposable income — over 35 000
rubles per month (see Table 1).
Then, in the Belgorod region cumulative function
of income shows that 4.2% of people have incomes of
up to 3 500 rubles, 10.5% to 5 000 rubles, 21.1% up to
7 000 rubles, 37.3% to 10 000, 58.7% to 15 000, 81.7% to
25 000, 91.2% to 35 000, and the remaining 8.8% — of
disposable income over 35 000 rubles a month.

For each region we build a linear approximation of
the distribution function of per capita income (see the
example in Figure 1). To determine how many people
in the Belgorod region have income less than 6 000 rubles, we find average on intervals of distribution function 5 000 (10.5%) and 7.000 (21.1%), and the resulting
15.8%.
Income distribution data exist for 82 Russia’s regions (for all 83 regions in Russia, with exception of
Republic of Chechnya).
We use income distribution functions for each region to construct the variable “share of population with
incomes below X”. Figure 2 shows the distribution of
Russia’s regions by this variable (“share of population
with incomes below X”) on 4 different X (Fig2a X=5000
rubles per month, Fig2b X=10 000 rubles per month, Fig2c X=20 000 rubles per month, Fig2d X=30 000 rubles per
month)We use electoral statistics to construct electoral
variable “the share of votes for candidate N”. We estimated “the share of votes for candidate N” as a share of
voters participated in president election. We constructed electoral variables for all five candidates (Zhirinovsky, Zyuganov, Mironov, Prokhorov, Putin). Also we constructed electoral variable for non-voters — as a share
of voters who were registered but did not participate.
Next, we looked for correlations between income
variables “share of population with incomes below X”
and electoral variables “the share of votes for candidate N”.
On Figure 3 presented scatterplots for electoral
variable “share of votes for Zhirinovsky” and income
variable “share of population with incomes below X” for
different X (Fig3a X=5000 rubles per month, Fig3b
X=10 000 rubles per month, Fig3c X=20 000 rubles per
month, Fig3d X=30 000 rubles per month)On each
scatterplot on Figure 3, vertical axis represents the
same electoral variable (“share of votes for Zhirinovsky”)
and horizontal axis — income variable “share of population with incomes below X” for different income levels
(5000, 10000, 20000, 30000 rubles per month)
Figures 4, 5, 6, 7, 8 present scatterplots (“income
variable” vs “electoral variable”) for other candidates
(Fig. 4: for Zyuganov, Fig. 5: for Mironov, Fig. 6: for
Prokhorov, Fig. 7 for Putin, Fig. 8: for non-voters.)

Table 1. Distribution of population by per capita income (as a percentage of the total for the Belgorod Region, 2010).

Per capita income, rub. per month

to
3500,0
from
3500,1 to
5000,0

from
5000,1
to 7000,0

from
7000,1
to 10000,0

from
10000,1
to 15000,0

from
15000,1
to 25000,0

from
25000,1
to 35000,0

more
35000,0

Belgorod region
4,2
6,3
10,6
16,2
21,4
23,0
9,5
8,8

Source: Regiony Rossii, 2011.
Review of Business and Economics Studies

Volume 2, Number 2, 2014

a)
b)

c)


d)

Figure 2. Distribution of Russian regions by the share of people with incomes less then:
a) 5000 rubles per month, b) 10 000 rubles per month, c) 20 000 rubles per month, d) 30 000 rubles per month.

Figure 1. Example of cumulative distribution function approximation of average monthly income (for the Belgorod region, 2010).
Review of Business and Economics Studies Volume 2, Number 2, 2014 4. MODEl: ElECTORAl bEhAVIOR AND INCOME DISTRIbuTION Previously we defined electoral variables as “the share of votes for candidate N” and income variables as “share of population with incomes below X”. In our analysis we are looking for correlations between electoral variables and income variables. We analyze such correlations on all possible income levels (up to 100 000 rubles per month). To analyze correlation between electoral and income variables we used model of simple pair regression (1): Share of votes a a Share of population with income _ _ _ _ _ _ _ 0 1 less than X e _ _ . (1) The advantage of this approach is simplicity (since we use a large number of such pairs of simple regression to assess the most relevant interval). At the same time, simple regression leaves many possible interpretations in addition to correlation between the independent and the dependent variables. For example, we can expect that income depends on other variables, which also affect the electoral preferences (level of urbanization, education level, gender, age, etc.). Realizing that this approach can be criticized, we nonetheless underscore its advantage. It reveals the link between income and electoral support for the candidate. Many other important variables (education, urbanization, gender, age) are correlated with income, but we are interested in correlation between electoral behaviors of different income groups. Figure 9 shows the distribution parameter estimation of the set of regressions where the dependent variable is the share of the vote for Zhirinovsky, and the explanatory variable is the “share of population with incomes below X”. Figure 9a shows the distribution of F-statistics, and Figure 9b — the distribution of t-statistics of the coefficient of the explanatory variable. In simple regression F-statistics coincides with the absolute value of t-statistics, we use t-statistics when the sign is important. Sign in the t-statistics is the sign of correlation between dependent and independent variables. The negative sign indicates the negative correlation between the share of votes for a candidate and a share of people with certain level of income. In Figure 9b points 1–4 correspond to the results of the regression estimates, based on data that are dis Figure 3. The share of votes for Zhirinovsky (vertical axis) vs. “share of people with incomes less then”: a) 5000 rubles per month, b) 10 000 rubles per month, c) 20 000 rubles per month, d) 30 000 rubles per month. a) b) c) d)
Review of Business and Economics Studies

Volume 2, Number 2, 2014

played in Fig. 3a — 3d. Point 1 in Fig. 9b corresponds to
the t-statistic (–4.60) for the coefficient of the explanatory variable b (–0.155) regression, based on data in Fig.
3a (for the income share of less than 5 thousand rubles).
Point 2 in Fig. 9b corresponds to the t-statistic (–3.75)
for the coefficient of the explanatory variable b (–0.0687)
regression, constructed from data in Figure 3b (for revenue share is less than 10 thousand rubles.). Point 3 in Fig.
9b corresponds to the t-statistic (–2.818) for the coefficient of the explanatory variable b (–0.045) regression,
based on data in Fig. 3c (for revenue share is less than 20

thousand rubles.). Point 4 in Fig. 9b corresponds to the
t-statistic (–2.198) for the coefficient of the explanatory
variable b (–0.045) regression, based on data in Fig. 3c
(for revenue share is less than 30 thousand rubles.)
In addition to the four points (1–4), for which we
have provided examples of the distribution of votes and
the percentage of people with a certain level of income
(in Fig. 3a-3d), the graph 9b contains coefficients of tstatistics for the income groups built around a set of distributed income from 0 to 100 thousand rubles. Five percent significance level t-statistics (for 82 observations)

a)


b)


c)


d)


Figure 4. The share of votes for Zyuganov (vertical axis) vs. “share of people with incomes less then”:
a) 5000 rubles per month, b) 10 000 rubles per month, c) 20 000 rubles per month, d) 30 000 rubles per month.
Review of Business and Economics Studies

Volume 2, Number 2, 2014

corresponds to the level of 1.99 (5%), which on the Fig.
9b reaches a level of income 35 thousand rub. The coefficient of the variable “proportion of people with incomes
below the X” is no longer statistically significant when x
is greater than 35 thousand rubles per month, in regressions explaining the share of votes cast for Zhirinovsky.
Similarly graphs 9a, 9b present the results of regressions explaining the share of votes for Zhirinovsky’s
presidential election in 2012, if the schedule 9a contains
the results of regression in which the share of votes for
Zhirinovsky explained by the percentage of people with

incomes from 0 to X, and a deferred variable on the horizontal axis, then the graph 9c shows the results that explain the voting share for Zhirinovsky in the proportion
of people with income from Y to X. The curves shown in
the graph 9a, a special case of the reduced dependence
in graph 9c (at Y = 0).
In the graph 9c we consider all possible income
groups, for example, not only income group from 0 to
5000 (point 1 on the chart 9a and Figure 3a), but also
of income from 1000 to 5000, from 2000 to 5000, from
3000 to 5000, from 4000 to 5000, not only income group

Figure 5. The share of votes for Mironov (vertical axis) vs. “share of people with incomes less then”:
a) 5000 rubles per month, b) 10 000 rubles per month, c) 20 000 rubles per month, d) 30 000 rubles per month.

a)


b)


c)


d)
Review of Business and Economics Studies

Volume 2, Number 2, 2014

0 to 20,000 (as a point on the graph 3 9a and Figure 3c),
but also of income from 5000 to 20000, 10000 to 20000,
15000 to 20000.
Zhirinovsky remains relevant in high-income areas,
which suggests that a certain number of supporters of
Zhirinovsky are present among middle-income voters,
and among the richest of the voters.
Fig. 10 shows examples of the distribution of population groups with income from Y to X for the Belgorod
region (Fig. 10a) and in Moscow (Figure 10b). Each point
on this graph represents the percentage of people (axis

Z) in the region with an income in the range from Y to
X. For example, a group of people with incomes between
20 and 60 thousand rubles (X = 60000, Y = 20000), in the
Belgorod region corresponds to the value of Z = 24.38
(i. e. the number of 24.38% of the total population), while
in Moscow Z = 34.13 (i. e. 34.13% of the total Moscow’s
population has income of 20 to 60 million).
Thus, the graph 9c coordinate Z (height above the
plane XY) has the value of F-score statistics regression,
in which the share of votes for Zhirinovsky explained by
the proportion of people with income from Y to X.

a)
b)

c)
d)

Figure 6. The share of votes for Prokhorov (vertical axis) vs. “share of people with incomes less then”:
a) 5000 rubles per month, b) 10 000 rubles per month, c) 20 000 rubles per month, d) 30 000 rubles per month.