
ЕCONOMETRIC FORECAST OF AGRICULTURAL SECTOR INVESTING IN LVOV REGION
Покупка
Основная коллекция
Издательство:
Редакция журнала RJOAS
Автор:
Литвин Р.
Год издания: 2014
Кол-во страниц: 5
Дополнительно
Доступ онлайн
от 49 ₽
В корзину
Скопировать запись
Фрагмент текстового слоя документа размещен для индексирующих роботов.
Для полноценной работы с документом, пожалуйста, перейдите в
ридер.
RJOAS, 7(31), July 2014
ECONOMETRIC FORECAST OF AGRICULTURAL SECTOR INVESTING IN LVOV REGION
Rostyslav Lytvyn, Research assistant
Lvov national university of veterinary medicine and biotechnologies named after S.Z. Gzhytskyj, Lvov, Ukraine E-mail: lytvynr@ukr.net
ABSTRACT
Purpose of economic processes forecasting in agriculture is more relevant and urgent in recent years with application of applied econometric methods. In represented research paper, these methods are used to forecast investment and the main agricultural industry indicators of Lvov region of Ukraine. The linear trend model, the parabolic trend model and the exponential trend model were elaborated from the period from 2000 to 2009 in this scientific study using applied statistical tool STATGRAFICS and EXCEL spreadsheets. And with assistance of these models forecast for investment on the basis of data of essential indicators of agrarian sector of the region for 2010 and 2011 was made. All models with probability р=0,95 are adequate experimental data for 2000-2009 years, that allow to make the forecast of investments and main agricultural indicators of the researched region by these models for 2010 and 2011 years. Nevertheless, it should be pointed out that, because of small amount of input data analysis of regression equations coefficients have more qualitative than quantitative influence upon resulting variable y6.
KEY WORDS
Investment; Agrarian sector; Forecasting; Linear trend model; Parabolic trend model; Exponential trend model.
Accordingly to statistical data of agricultural sector of Lvov region and Ukraine provided by State Statistical Service of Ukraine for 2000-2009 years, presented in tables (1) in this applied research calculate main dynamics and trend models and calculate predicted values and their estimates for forthcoming two years with application of the applied statistical tool STATGRAFICS and EXCEL spreadsheets.
To vital issues of investing processes in agriculture of Ukraine’s economy have dedicated one’s researches many prominent scientists, among them: A. Carita, I. Luyt, N. Santos et al. [1], K. Crane, F.S. Larrabee [2], K. Vitale [3] and others. In this research one’s attention is paid to study investment of agriculture of Ukraine and another developing economies with assistance of econometric methods, that are displayed in scientific works of: V. Yeleyko, О. Yeleyko, I. Kopych, R.. Bodnar, М. Demchyshyn, О. Synytskyy, А. Chemerys [4-7], M.I. Gomez, E.R. Gonzales, L.F. Melo [8], F. Ruff [9], N. Carnot, V. Koen, B. Tissot [10], R.S. Mariano, Y.K. Tse [11] and R. Gupta, A. Kabundi [12].
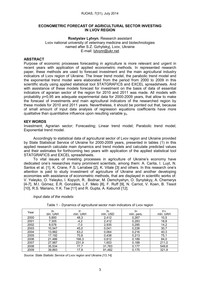
Input data of the models:
Table 1 - Dynamics of agricultural sector main indicators of Lvov region
Year y6 y7 ys y9 y10
bln. UAH mln. UAH mln. USD mln. pers. mln. UAH
2000 5,850 48,3 2,412 0,267 10,5
2001 7,305 -4,2 2,412 0,283 18,8
2002 8,578 -7,0 2,935 0,285 14,2
2003 10,547 45,0 0,041 0,228 30,7
2004 13,992 63,2 0,064 0,216 40,3
2005 17,192 70,8 0,438 0,213 75,1
2006 21,486 166,3 0,612 0,189 84,0
2007 27,987 231,9 1,653 0,188 211,0
2008 35,534 77,7 31,783 0,177 549,8
2009 39,893 17,9 91,482 0,175 321,9
Source: State Statistic Service of Lvov region and Ukraine [13,14].
3
Доступ онлайн
от 49 ₽
В корзину