
Review of Business and Economics Studies, 2018, том 6, № 2
Покупка
Основная коллекция
Тематика:
Экономика. Бухгалтерский учет. Финансы
Наименование: Review of Business and Economics Studies
Год издания: 2018
Кол-во страниц: 76
Дополнительно
Вид издания:
Журнал
Артикул: 705327.0001.99
Тематика:
ББК:
УДК:
ГРНТИ:
Скопировать запись
Фрагмент текстового слоя документа размещен для индексирующих роботов.
Для полноценной работы с документом, пожалуйста, перейдите в
ридер.
Review of
Business and
Economics
Studies

EDITOR-IN-CHIEF
Prof. Alexander Ilyinsky
Dean, International Finance
Faculty, Financial University, Moscow,
Russia
ailyinsky@fa.ru

EXECUTIVE EDITOR
Dr. Zbigniew Mierzwa

EDITORIAL BOARD

Dr. Mark Aleksanyan
Adam Smith Business School,
The Business School, University
of Glasgow, UK

Prof. Edoardo Croci
Research Director, IEFE Centre for
Research on Energy and Environmental
Economics and Policy, Università
Bocconi, Italy

Prof. Moorad Choudhry
Dept.of Mathematical Sciences, Brunel
University, UK

Prof. David G. Dickinson
Department of Economics, Birmingham
Business School, University
of Birmingham, UK

Prof. Chien-Te Fan
Institute of Law for Science and
Technology, National Tsing Hua
University, Taiwan

Prof. Wing M. Fok
Director, Asia Business Studies, College
of Business, Loyola University New
Orleans, USA

Prof. Konstantin P. Glushchenko
Faculty of Economics, Novosibirsk State
University, Russia

Prof. George E. Halkos
Associate Editor in Environment and
Development Economics, Cambridge
University Press; Director of Operations
Research Laboratory, University of
Thessaly, Greece

Dr. Christopher A. Hartwell
President, CASE — Center for Social
and Economic Research, Warsaw,
Poland

Prof. Sebastian Jaimungal
Associate Chair of Graduate
Studies, Dept. Statistical
Sciences & Mathematical Finance
Program, University of Toronto,
Canada

Prof. Vladimir Kvint
Chair of Financial Strategy, Moscow
School of Economics, Moscow State
University, Russia

Prof. Alexander Melnikov
Department of Mathematical and
Statistical Sciences, University of
Alberta, Canada

Prof. George Kleiner
Deputy Director, Central Economics and
Mathematics Institute, Russian Academy
of Sciences, Russia

Prof. Kern K. Kwong
Director, Asian Pacific Business
Institute, California State University,
Los Angeles, USA

Prof. Dimitrios Mavrakis
Director, Energy Policy and
Development Centre, National and
Kapodistrian University of Athens,
Greece

Prof. Stephen McGuire
Director, Entrepreneurship Institute,
California State University,
Los Angeles, USA

Prof. Rustem Nureev
Сhairman for Research of the
Department of Economic Theory,
Financial University, Russia

Dr. Oleg V. Pavlov
Associate Professor of Economics and
System Dynamics, Department of Social
Science and Policy Studies, Worcester
Polytechnic Institute, USA

Prof. Boris Porfiriev
Deputy Director, Institute of Economic
Forecasting, Russian Academy of
Sciences, Russia

Prof. Thomas Renstrom
Durham University Business School,
Department of Economics and Finance,
Durham University

Prof. Alan Sangster
Professor of Accounting (Business and
Management) at University of Sussex, UK

Prof. Svetlozar T. Rachev
Professor of Finance, College of
Business, Stony Brook University, USA

Prof. Boris Rubtsov
Deputy chairman of Department
of financial markets and banks for R&D,
Financial University, Russia

Dr. Shen Minghao
Director of Center for Cantonese
Merchants Research, Guangdong
University of Foreign Studies, China
Prof. Dmitry Sorokin
Chairman for Research, Financial
University, Russia

Prof. Robert L. Tang
Chancellor for Academic, De La Salle
College of Saint Benilde, Manila, The
Philippines

Dr. Dimitrios Tsomocos
Saïd Business School, Fellow in
Management, University of Oxford;
Senior Research Associate, Financial
Markets Group, London School
of Economics, UK

REVIEW OF BUSINESS
AND ECONOMICS STUDIES
(ROBES) is the quarterly peerreviewed scholarly journal published
by the Financial University under
the Government of Russian
Federation, Moscow. Journal’s
mission is to provide scientific
perspective on wide range of topical
economic and business subjects.

CONTACT INFORMATION
Financial University
Leningradsky prospekt, 53,
office 5.6
123995 Moscow
Russian Federation
Telephone: +7 (499) 943-98-02
Website: www.robes.fa.ru

AUTHOR INQUIRIES
Inquiries relating to the
submission of articles can be sent
by electronic mail to robes@fa.ru.

COPYRIGHT AND PHOTOCOPYING
© 2018 Review of Business and
Economics Studies. All rights
reserved. No part of this publication
may be reproduced, stored
or transmitted in any form or by any
means without the prior permission
in writing from the copyright holder.
Single photocopies of articles may
be made for personal use as allowed
by national copyright laws.
ISSN 2308-944X
Вестник
исследований
бизнеса
и экономики

ГЛАВНЫЙ РЕДАКТОР
А.И. Ильинский, профессор, декан
Международного финансо вого факультета Финансового университета

ВЫПУСКАЮЩИЙ РЕДАКТОР
Збигнев Межва, д-р экон. наук

РЕДАКЦИОННЫЙ СОВЕТ

М.М. Алексанян, профессор Бизнесшколы им. Адама Смита, Университет
Глазго (Великобритания)

К. Вонг, профессор, директор Института азиатско-тихоокеанского бизнеса
Университета штата Калифорния,
Лос-Анджелес (США)

К.П. Глущенко, профессор экономического факультета Новосибирского
госуниверситета

С. Джеимангал, профессор Департамента статистики и математических финансов Университета Торонто
(Канада)

Д. Дикинсон, профессор Департамента экономики Бирмингемской бизнесшколы, Бирмингемский университет
(Великобритания)

В.Л. Квинт, заведующий кафедрой
финансовой стратегии Московской
школы экономики МГУ, профессор
Школы бизнеса Лассальского университета (США)

Г. Б. Клейнер, профессор, член-корреспондент РАН, заместитель директора Центрального экономико-математического института РАН

Э. Крочи, профессор, директор по
научной работе Центра исследований
в области энергетики и экономики
окружающей среды Университета
Боккони (Италия)

Д. Мавракис, профессор,
директор Центра политики
и развития энергетики
Национального университета
Афин (Греция)

С. Макгвайр, профессор, директор Института предпринимательства
Университета штата Калифорния,
Лос-Анджелес (США)

А. Мельников, профессор
Депар та мента математических
и ста тистических исследований
Университета провинции Альберта
(Канада)

Р.М. Нуреев, профессор, научный
руководитель Департамента экономической теории Финансового
университета

О.В. Павлов, профессор
Депар та мента по литологии
и полити ческих исследований
Ворчестерского политехнического
института (США)

Б.Н. Порфирьев, профессор,
член-корреспондент РАН, заместитель директора Института
народнохозяйственного прогнозирования РАН

С. Рачев, профессор
Бизнес-кол леджа Университета
Стони Брук (США)

Т. Ренстром, профессор,
Школа Бизнеса Даремского
университета,
Департамент Экономики и Финансов

Б.Б. Рубцов, профессор,
заместитель руководителя
Департамента финансовых рынков
и банков по НИР Финансового
университета

А. Сангстер, профессор,
Сассекский университет
(Великобритания)

Д.Е. Сорокин, профессор, членкорреспондент РАН, научный
руководитель Финансового
университета

Р. Тан, профессор, ректор
Колледжа Де Ла Саль Св. Бенильды
(Филиппины)

Д. Тсомокос, Оксфордский университет, старший научный сотрудник
Лондонской школы экономики
(Великобритания)
Ч.Т. Фан, профессор, Институт
права в области науки и технологии,
национальный университет Цин Хуа
(Тайвань)

В. Фок, профессор, директор по
исследованиям азиатского бизнеса Бизнес-колледжа Университета
Лойола (США)

Д.Е. Халкос, профессор, Университет
Фессалии (Греция)

К.А. Хартвелл, президент Центра
социальных и экономических исследований CASE (Польша)

М. Чудри, профессор, Университет
Брунеля (Великобритания)

М. Шен, декан Центра кантонских
рыночных исследований Гуандунского университета (КНР)

Редакция научных журналов
Финансового университета
123995, Москва, ГСП-5,
Ленинградский пр-т, 53,
комн. 5.6
Тел. 8 (499) 943-98-02.
Интернет: www.robes.fa.ru.

Журнал “Review of Business and
Economics Studies” («Вест ник
исследований бизнеса и экономики») зарегистрирован в Федеральной службе по надзору
в сфере связи, информационных
технологий и массовых коммуникаций 15 сентября 2016 г.
Свидетельство о регистрации
ПИ № ФС77-67072.

Подписано в печать: 23.05.2018.
Формат 60 × 84 1/8.
Заказ № 535 от 23.05.2018.
Отпечатано в Отделе полиграфии
Финуниверситета
(Ленинградский проспект, д. 49).
16+
The Relationship between Growth

and the Environment in Beijing,

Using PM2.5 Concentrations

D. I. Jingyuan, L. I. Chong, Laura Marsiliani  .  .  .  .  .  .  .  .  .  .  .  .  .  .  .  .  .  .  .  .  .  .  .  .  .  .  .  .  .  .  .  .  .  .  .5

Protection of Environment during Armed Conflicts

Tshibola Lubeshi Aimée Murphie   .  .  .  .  .  .  .  .  .  .  .  .  .  .  .  .  .  .  .  .  .  .  .  .  .  .  .  .  .  .  .  .  .  .  .  .  .  .  .  .  .  .19

Value Concepts and Value Creation Model

in Integrated Reporting

Elvira Sheveleva  .  .  .  .  .  .  .  .  .  .  .  .  .  .  .  .  .  .  .  .  .  .  .  .  .  .  .  .  .  .  .  .  .  .  .  .  .  .  .  .  .  .  .  .  .  .  .  .  .  .  .  .  .  .  .  .30

Mergers and Acquisitions of Enterprises

as a Tool for Increasing Value and Competitiveness:

The case of Masan and Singha

Do Thi Ngoc Anh, Elena Miroshina (Silantieva)  .  .  .  .  .  .  .  .  .  .  .  .  .  .  .  .  .  .  .  .  .  .  .  .  .  .  .  .  .  .  .44

Comparative Analysis of Sovereign Credit Ratings. Statics

Alexey Ivkin  .  .  .  .  .  .  .  .  .  .  .  .  .  .  .  .  .  .  .  .  .  .  .  .  .  .  .  .  .  .  .  .  .  .  .  .  .  .  .  .  .  .  .  .  .  .  .  .  .  .  .  .  .  .  .  .  .  .  .  .50

Review of
Business and
Economics
Studies

Volume 6, Number 2, 2018
Вестник
исследований
бизнеса
и экономики

№ 2, 2018

Взаимосвязь между экономическим ростом

и окружающей средой в Пекине

на основе показателя PM2.5

D. I. Jingyuan, L. I. Chong, Laura Marsiliani  .  .  .  .  .  .  .  .  .  .  .  .  .  .  .  .  .  .  .  .  .  .  .  .  .  .  .  .  .  .  .  .  .  .  .  .  . 5

Защита окружающей среды

во время вооруженных конфликтов

Tshibola Lubeshi Aimée Murphie   .  .  .  .  .  .  .  .  .  .  .  .  .  .  .  .  .  .  .  .  .  .  .  .  .  .  .  .  .  .  .  .  .  .  .  .  .  .  .  .  .  .  .  . 19

Концепции и модель создания стоимости

в интегрированной отчетности

Эльвира Шевелева   .  .  .  .  .  .  .  .  .  .  .  .  .  .  .  .  .  .  .  .  .  .  .  .  .  .  .  .  .  .  .  .  .  .  .  .  .  .  .  .  .  .  .  .  .  .  .  .  .  .  .  .  .  .  . 30

Слияния и поглощения предприятий

как инструмент повышения стоимости и конкурентоспособности:

случай Масана и Синга

До Тхи Нгок Ань, Елена Мирошина   .  .  .  .  .  .  .  .  .  .  .  .  .  .  .  .  .  .  .  .  .  .  .  .  .  .  .  .  .  .  .  .  .  .  .  .  .  .  .  .  . 44

Сравнительный анализ суверенных

кредитных рейтингов. Статика

Алексей Ивкин  .  .  .  .  .  .  .  .  .  .  .  .  .  .  .  .  .  .  .  .  .  .  .  .  .  .  .  .  .  .  .  .  .  .  .  .  .  .  .  .  .  .  .  .  .  .  .  .  .  .  .  .  .  .  .  .  .  .  . 50
1. Introduction
The environmental Kuznets curve (EKC) hypothesis states that economic growth leads to
degradation and pollution but, beyond some
level of income per capita, it is conducive to an
improvement in environmental quality (inverted U-shaped relationship). The EKC hypothesis
has become a powerful tool in analysing the
empirical relationship between growth and
the environment. The literature on the EKC
has relentlessly proliferated since the seminal
contribution of Grossman and Krueger in 1991,
to take into account different pollutants and
control variables 1.

1 See for example, the country level studies by Grossman and
Krueger (1995), Shafik and Bandyopadhyay (1992), Panayotou
(1992, 1993 and 1995), Cropper and Griffiths (1994), Bhattarai
and Hamming (2001), Markandya et al. (2006), Plassmann and
Khanna (2006).

A recently published paper by Stern and Zha
(2016) highlights two very recent developments
in the extensive literature on EKC hypothesis,
namely the importance of ambient pollution
concentrations and the opportunity offered by
newly recorded particular matter (PM2.5) at
urban level.
The need to consider ambient pollution
within the EKC framework is embedded in the
concept of Urban EKC. The urban dimension is
generally captured by including variables shedding light on the relationship between ambient
pollution and economic growth, such as emissions from urban transport, suspended particular
matter in urban areas, municipal solid waste,
population density, characteristics of transport
network etc. Examples of studies within the
Urban EKC literature are Hilton and Levinson
(1998) for 47 countries, Day and Grafton (2003)

Review of Business and Economics Studies
doi: 10.26794/2308-944X-2018-6-2-5-18
2018, Vol. 6, No. 2, 5-18
The Relationship between Growth and
the Environment in Beijing, Using PM2.5
Concentrations

d. i. Jingyuan 1, L. i. Chong 2, Laura Marsiliani 3

1 Ph.d. candidate, durham University Business School, durham University, United Kingdom; jingyuan.di@durham.ac.uk

2 Ph.d. candidate, School of Economics, Sichuan University, China; sculichong@foxmail.com

3 Ph.d. (corresponding author), durham University Business School, durham University, United Kingdom; Laura.
marsiliani@durham.ac.uk

Abstract
This study examines the relationship between income and the environment in Beijing from 2008 to 2017 using
quarterly data. The indicator for environmental quality is concentrations of Particular Matter (PM) 2.5, from the
Mission China Air Quality Monitoring Programme (MCAQMP), whose observation site is in the US embassy in
Chaoyang district, Beijing. By adding cubic GdP and other variables consistent with the Urban Environmental
Kuznets Curve Hypothesis, such as green space and the length of the road network, the result suggests an
N-shaped pattern rather than the conventional inverted U shape. The per capita GdP for Beijing is currently
slightly lower than the second turning point, suggesting that the degradation would become more severe as
income grows, if no new development strategies are implemented in the city.
Keywords: Environmental Kuznets Curve; PM2.5; Beijing
JEL Classification: O18, Q53, Q56

Acknowledgements: We wish to thank Riccardo Scarpa, seminar participants at durham University, two
anonymous referees and an associate editor for valuable comments that greatly improved this paper. The first
author is also grateful to the China Scholarship Council for financial support while undertaking this research.
for Canada, Orubu and Omotor (2011) for African
countries, Asahi and Yakita (2012) and Hossain
and Miyata (2012) for the urban areas of Yokkaichi and Toyohashi, Japan, Kim et al., (2016)
for South Korea and Sinha and Bhattacharya
(2016) for India.
Nevertheless, to our knowledge, most of the
research on the Urban EKC is based on China
either at province or city level, as China is experiencing a remarkable urbanisation growth,
coupled with consistently high energy consumption and pollution (Dhakal, 2009) 2. Since
the early 2000s, studies on the urban EKC in
China have been undertaken with regularity
and include a wide range of environmental
and urban indicators. Results also support a
variety of estimated EKC, from the standard
inverted U-shape to the more unusual U-shape
and N-shape.
As data for PM2.5 concentrations have only
recently become available with sufficient frequency 3, EKC studies using PM2.5 as an indicator
of ambient pollution are scarce (Stern & Zha,
2016; Hao & Liu, 2016). Yet PM2.5 concentrations have been proven to be extremely harmful
to human health 4 by affecting respiratory and
cardiovascular functions and causing cancer,
and to ecological system.
In this paper, we examine the relationship
between income and the environment in Beijing
using PM2.5 concentrations as our chosen environmental indicator. In addition to being the
national capital of China, Beijing is identified
in the latest Chinese national plan 5 as one of
35 major cities in terms of size and economic
significance. These cities, with less than 20%
of the national population, account for 40% of
total energy consumption and are characterized

2 The percentage of population living in urban areas has increased in China from 40% in 2005, to 57.3% in 2016, with 790
million residents in urban areas (see https://data.worldbank.
org/indicator/SP.URB.TOTL.IN.ZS).

3 Only recently, concentrations of PM2.5 have been regulated
and regularly recorded. Although some measurement of PM2.5
concentration was undertaken in the US already in the late
1990s, the US implemented daily standards in 2007, followed
by Japan in 2009, Russia in 2010 and more recently by the EU
and South Korea in 2015.

4 See Sørensen et al. (2003), Cohen et al. (2005), US EPA (2009),
Janssen et al. (2011).

5 See http://www.mlr.gov.cn/tdsc/djxx/djjc/201004/
t20100401_143692.htm. Beijing has been listed as one of the
main observation cities since 2008, by the Ministry of Housing
and Urban-Rural Development.

by high pollution levels. As PM2.5 is considered
an ambient pollutant, we include relevant local
variables such as green space, and length of
road network as controls. By using a recently
available dataset for PM2.5 from the Mission
China Air Quality Monitoring Programme
(MCAQMP) which possesses high reliability 6,
we are able to provide the first EKC analysis
of a Chinese city for the medium run. Contrary
to most of the existing literature, our analysis
supports an N-shaped EKC relationship 7. The
first turning point is about 60,000 CNY per year
while the second turning point is about 132,000
CNY per year. The income at the second turning
point is just above the current average income
of Beijing residents. The improved environment
quality in the last several years can mainly be
attributed to the implementation of stringent
government environmental policy while the
latest spur in pollution may be a consequence
of the stimulus growth policies implemented
since late 2014 8. These results suggest that in
the next decades, it may be extremely challenging to achieve stable growth rates and high air
quality in China.
The paper proceeds as follow: Section 2 surveys the existing literature on Urban EKC hypothesis for China; Section 3 describes the data
used in this paper; Section 4 focuses on the empirical model and the econometric methodology;
Section 5 presents the results from our empirical
analysis; Section 6 includes some policy implications for Beijing and section 7 concludes and
offers suggestions for future research on the
Urban EKC.

2. A Survey of the Existing Literature
on the Urban EKC in China
To our knowledge, the first study that addresses the existence of EKC in China is De Groot
et al., (2004). They use data from 30 provinces

6 Official data from China has been found not to be reliable as
air quality measurements are related to the career progression
opportunities of officials and therefore may be prone to manipulation (See Chen et al., 2012 and Ghanem & Zhang, 2014).

7 Other EKC studies that find an N-shaped EKC, although in
a different setting, are Shafik and Bandayopadhyay (1992),
Grossman and Krueger (1993), Selden and Song (1994), Panayotou (1997).

8 See Bloomberg. (2015). China Stimulus Kicks in to Help Keep
2014 Growth Near Target. Available at https://www.bloomberg.
com/news/articles/2015–01–19/china-gdp-beats-estimatesleaving-2014-expansion-close-to-target.

The Relationship between Growth and the Environment in Beijing, Using PM2.5 Concentrations
from 1982 to 1997 and include waste water,
water gas, and solid waste, as environmental
indicators and a regional specific intercept.
Their results support a typical EKC for water
gas, an N-shaped relationship for solid waste,
and a monotonically decreasing relationship
for waste water.
Shen (2006) examines the EKC hypothesis
for 31 Chinese provinces. It includes five pollutants, Sulphur Dioxide (SO2) and Fall Dust for air,
Organic Pollutants, Arsenic, and Cadmium for
water, with population density, industrial share
and abatement expense as control variables. The
results suggest an EKC relationship for water
pollutants and for SO2, but no relationship for
Fall Dust.
Liu et al., (2007) test the EKC hypothesis in
Shenzhen, based on data from 1989 to 2003.
They include a large number of pollutants for
several environmental media, including major
rivers and near-shore water. The results show
that production induced pollution support the
canonical EKC hypothesis, while consumption
related pollutants do not.
Brajer et al. (2008) test the relationship between SO2 and per capita income based on city
level data in China from 1990 to 2004, with
population density as control. Using different
econometric methods, both the inverted Ushaped and N-shaped EKC are supported.
Based on Chinese provincial data from 1985
to 2005, Song et al. (2008) investigate the EKC
hypothesis between GDP per capita and three
environmental indicators: waste water, waste
gas, and solid waste, without adding control
variables. Their results assert that all these
three environmental indicators follow an inverted U-shape EKC relationship and the turning point for waste gas is lower than the other
two indicators.
Diao et al., (2009) analyse the relationship
between GDP per capita and a number of industrial pollutants, with environmental policies, investment strategies, and contribution
to GDP as control variables, for Jiaxing city. An
inverted U-shape relationship is observed for
industrial waste water, industrial waste gas, SO2,
and industrial dust. The turning points for the
pollutant are generally lower than previous studies in China and lower than the turning points
in developed countries and can be explained

by the early local government policies against
industrial pollution.
Shaw et al. (2010) examine the EKC hypothesis for 99 cities in China from 1992 to 2004. Air
pollution includes SO2, Nitrogen Oxide (NOx)
and particle deposition, and control variables
include population density, contribution of
secondary industry to GDP, and a policy variable. The conclusion shows only SO2 supports
an inverted U shape, while NOx increases as
income grows.
He and Wang (2012) analysis the impact of
economic structure, development strategy and
environmental regulation on the shape of the
EKC, using city level data from 1990 to 2001.
The relationship between environmental indicators, SO2, NOx, total suspended particles
(TSP) and GDP per capita are examined, with
openness, regulation, population density, area,
and capital/labour ratio as control variables.
Openness, measured by FDI, always increases
the level of the three pollutants, and capital
abundance increase the concentration of TSP
but decrease the concentration of NOx.
Luo et al., (2014) support a negative linear
relationship between Gross Regional Product
per capita and particulate matter 10 (PM10)
concentrations in all province capitals for the
last decade. However, only the PM10 concentration in the central parts of China is significantly
related to GRP.
Sun and Yuan (2015) examine the relationship between GDP per capita and three indicators for environment, including industrial
SO2, industrial soot, and industrial sewage discharged, based on data for 287 cities in China
from 2003 to 2008. Besides, population density,
area, variables standing for agglomeration were
used as control variables. Their results show
an N-shaped EKC for all three pollutants with
industrial agglomeration having a significant
influence on regional environmental quality.
Zhang et al. (2016) analyse the relationship
between a comprehensive air quality index (API)
and wealth based on data for 26 capital cities
and 4 municipalities in China from 2002 to
2010. As control they include population size,
urbanization level, industrialization level, green
coverage level, and pollution control investment. Economic level shows an inverted U shape
EKC and the turning point is about 63,000 CNY.

The Relationship between Growth and the Environment in Beijing, Using PM2.5 Concentrations
Wang and Ye (2017) illustrate the monotonic increasing relationship between Carbon
Dioxide (CO2) emission and GDP per capita
using city-level data and employing a spatial
lag model and a spatial error model. As a novelty from the previous literature, Wang and
Ye include dummy variables for coastal and
central cities.
Finally, the latest developments in the literature include the use of particulate matters
2.5 data. Stern and Zha (2016) use PM10 and
PM2.5 data from the years 2013 and 2014 for
50 Chinese cities to regress pollution growth
on GDP growth. They find U-shaped relationship which however results to be statistically
insignificant. Similarly, based on data for 73
Chinese cities in 2013, Hao and Liu (2016) examine the influence of GDP per capita, population density, transport, and industry on air
quality. All estimation models, OLS, spatial
lag model (SLM) and spatial error model (SEL)
support a U-shaped EKC.
Given the fast-paced developments in connection to the Urban EKC hypothesis and the
growing interest for China, as a key player in
the global economy, we expect this literature to
expand considerably in the next few years. Our
paper intends to contribute to this literature by
focusing on the case of Beijing.

3. Data
In this paper, the urban unit of reference is
the city of Beijing and the pollutant used for
the analysis is PM2.5 concentrations, whose
source is local. Controls are also local level
variables such as population, green space and
length of road network. In the proceedings
of this chapter we exactly define the urban
area, the data and all issues surrounding their
measurements.
The reason why the paper focuses on Beijing
rather than other cities can be explained from
several perspectives. Firstly, Beijing, as the
capital of China, has all the hallmarks of an
ideal unit of investigation for the EKC Hypothesis. Indeed, the city attracts large amounts of
labour, capital, and intelligence resources which
contribute to the rapid urban development, but
also the degradation of the city’s air quality.
Secondly, Beijing is due to undergo an ambitious urban restructuring plan as highlighted

in the city development plan for the year 2035 9.
Beijing will raise its profile as the political
centre of China by focusing on developing its
tertiary sector rather than industrial production and agriculture and restricting granting
permanent residency rights to highly skilled
workers. Heavy industries have already been
relocated to neighbourhood provinces such
as Hebei and Tianjin to decrease the effects
of sulphur dioxide and particulate matter 10.
Therefore, the findings of this paper may inform
the city planners of the likely environmental
impact of further development projects in the
city. Thirdly, the availability of data for Beijing
is higher than for other cities.

3.1. Definition of Urban Area
According to the China City Statistical Yearbook, 2016, Beijing metropolitan area includes 16 districts (see map in Figure A below).
Dongcheng and Xicheng Districts are the core
parts of Beijing, historically dating back to the

9 See Beijing government. (2017). Beijing General Urban Plan
2020–2035 . Available at http://zhengwu.beijing.gov.cn/gh/dt/
t1494703.htm.

10 One example is the Shougang Group, one of the largest steel
companies located in Beijing that started moving to Hebei
since 2005 in the preparation for the Olympic Games of 2008.

Figure A: Beijing Metropolitan Area.

Source: http://www.dsac.cn/file/attached/ima
ge/20150720/20150720164446_6118.jpg

The Relationship between Growth and the Environment in Beijing, Using PM2.5 Concentrations
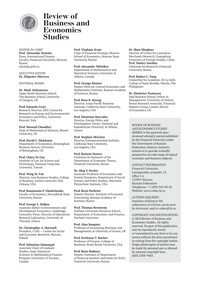
Qing Dynasty 11. Together with the four surrounding districts of Haidian, Chaoyang, Fengtai and Shijingshan, they are referred to as the
Urban Six District. In 1949, six more districts
were added to the Beijing metropolitan administrative area: Shunyi, Changqing, Mentougou,
Fangshan, Daxing, and Tongzhou. As the 2035
city plan indicates, these districts are becoming increasingly important, with the city administrative offices being gradually moved to

11 In 2010, the districts of Dongcheng (1 in the map in Figure A) and Chongwen (3 in the map) were merged into the
Dongcheng district, and the districts of Xuanwu (2 in the map)
and Xicheng (4 in the map) were merged into the Xicheng district.

this suburban area. In 2000, four more districts
in the north of Beijing were included in the Beijing metropolitan area.
Recently, the newly-published city planning
encourages residents to move away from the
Urban Six Districts to other districts, in order to
enjoy better living conditions and lower house
prices. Therefore, nowadays, many workers still
need to commute daily to the Urban Six Districts
for work. As one of the major sources for local
PM2.5 concentrations is transport (Zíková et al.,
2016), it makes sense to include all 16 districts
of Beijing into our investigation area.
According to the statistic Yearbook of China,
the acreage of Beijing does not change from April

0

20

40

60

80

100

120

140

160

1
3
5
7
9
11 13 15 17 19 21 23 25 27 29 31 33 35 37 39

seasonal effect of air quality: PM 2.5

AIRQUALITY
ma.air

0

1000

2000

3000

4000

5000

6000

7000

8000

1
3
5
7
9
11 13 15 17 19 21 23 25 27 29 31 33 35 37 39

seasonal effect of GDP

GDP
ma.gdp

Figure B: Seasonal effects.

Source: own elaboration from relevant data.

The Relationship between Growth and the Environment in Beijing, Using PM2.5 Concentrations
2008 to June 2017, despite the implementation
of a few changes affecting the districts borders 12.
Therefore, acreage is not considered as a variable
in this paper. Also, as acreage is fixed we only
use population and not population density to
capture the effects of urbanisation.

12 One is the consolidation of the four central districts into two,
Dongcheng and Xicheng, in 2008; another is the establishment
of a new district, Xiong’an, in 2017.

3.2. Data Description
Data for environmental quality PM PM2.5 concentrations are from the Mission China Air
Quality Monitoring Programme (MCAQMP)
available online at http://www.stateair.net/
web/historical/1/1.html, which started as a
means to provide reliable information about
air quality in China for US expats. The observation site is in the US Embassy, which is
located in the Chaoyang District, one of the

Table A
Data Description

Data
Source
Website
Frequency
Time span

PM2.5
US Embassy
http://www.stateair.net/web/
historical/1/1.html
hourly
Since April
2008

Population
Beijing Macroeconomics
database
http://www.bjhgk.gov.cn/
yearly
1949–2016

GdP
Beijing Bureau of Statistics
http://www.bjstats.gov.cn/tjsj/
yjdsj/GdP/2018/
quarterly
Since
Q1 2005

Green
Space
Beijing Macroeconomics
database
http://www.bjhgk.gov.cn/
yearly
Since 1975

Length
of road
network

Beijing Macroeconomics
database
http://www.bjhgk.gov.cn/
yearly
2003–2016

T
Time trend: T= year-2007

Quarter1
dummy Variable; =1 when the data is in the 1st quarter; =0 in 2,3,4 quarter

Quarter2
dummy Variable: =1 when the data is in the 2nd quarter; =0 in 1,3,4 quarter

Quarter3
dummy Variable::=1 when the data is in the 3rd quarter; =0 in 1,2,4 quarter

Table B
Descriptive Statistics

Variable
Mean
Std. Dev
Min
Max
No. of
observation

Air quality
91.6
21.5
53.9
146.8
37

Population
2029.2
141.0
1732.6
2174.1
37

GdP
4564.6
1301.1
2511.9
7531.5
37

GdP per capita
2.2
0.5
1.4
3.5
37

Green space
15.3
0.9
13.2
16.4
37

Length of road
network
14.0
0.6
13.3
15.2
37

The Relationship between Growth and the Environment in Beijing, Using PM2.5 Concentrations
busiest downtown areas in Beijing. Air quality
recordings from the embassy site are less frequents than recordings from official national
sites, nevertheless, they are the longest publicly available recorded data for PM2.5 in Beijing having started in April 2008. In addition, a
new study (Zhang & Mu, 2017) finds that the
data for PM2.5 from the Chinese Ministry of
Environmental Protection are correlated with
the data from the US Embassy, hence we expect
our results not to be biased.
Our dataset contains data from April 2008
to May 2017, typically with one observation per
hour. Tables A and B below gives a brief summary
of the data and their descriptive statistics. Our
indicator for pollution is the quarterly average
of PM 2.5 concentrations from the second quarter of 2008 to the second quarter of 2017 (the
longest interval we have data for). There are 37
observations in total.
The data for population and GDP are from the
Statistic Yearbook of Beijing. Quarterly data for
GDP are available, while for population defined
as the number of residents in Beijing metropolitan area, observations are annual. By calculating the growth rate of population each
year, interpolation is used for population. For
other variables, including length of road network
and green space, we use the same interpolation
method to generate more data points for our
regression analysis.
As both the data for PM2.5 and GDP present
the problem of seasonality (see graphs below)
we smooth the series by applying the moving
average method.
Other variables of interest are green space
(Zhang et al., 2016) and length of roads as those
have been identified in the literature as having
an impact on urban pollution. Green space, or
parks, plays an essential role in ameliorating
air quality in a city. Yin et al., (2011) estimate
that vegetation in Shanghai contributes to 9.1%
of TSP removal. Tallis et al., (2011) estimate
that the removal of PM10 by urban trees in
the Greater London Authority is between 0.7%
and 1.4%. Longer road length is supposed to
serve more vehicles. Vehicles and dust from
the road are a major source of PM2.5 in urban areas (Cassady et al., 2004); furthermore,
increasing highways capacity is found to be
positively related to the vehicle mileages, sug
gesting a positive correlation with emissions
as well (Noland, 2000).

4. Model and Methodology
The empirical model used in this paper is
based on Grossman and Kruger (1995) and can
be expressed as:

(
)

(
)

(
)

0
1

2
2

3

3
4

ma.airquality
.
/

.
/

.
/

ma gdp
population

ma gdp
population

ma gdp
population
Z

= β +β
+

+β
+

+β
+β
+ ε

where, ma.airquality  is measured by PM2.5
concentrations;
.
/
ma gdp
population  is Beijing per capita GDP. For completeness we
both include the squared and cubic values of

.
/
ma gdp
population . As control variables, we use:
Greenspace (including public parks); Length of
the road network (the length of road per capita,
an indicator for transport activities); Year, a
linear time trend; 3 dummy variables, one per
quarter to capture the seasonal effects of pollution (with Q4 being our omitted dummy). We
perform OLS estimations.
In the EKC literature, the most common
shape for the relationship between income
and pollution is an inverted u-shape pattern,
that means
3
β  should be insignificant, while

1
2
,β β  should be both significant with
1
0
β >

and
2
0
β <
. For other patterns the coefficients
take on the signs reported in the Table C below
(Song et al., 2008).

5. Results
Table D below presents the results of 4 OLS regressions. Regressions 3 and 4 use logs of all
variables, regressions 2 and 4 do not include
green space and length of road as those are
found to be highly correlated with GDP (see
Table E below).
All four regressions (although the coefficients
in regression 1 and 3 are not statistically significant) show an N-shaped relationship between
air quality and income, with positive coefficient
for per capita GDP and GDP cubic and negative
for GDP square.
In regression 2, all coefficients are significant,
and the goodness of fit is high (R 2 = 0.86), indicating that regression 2 is a good description of
the EKC relationship in Beijing. The first turning

The Relationship between Growth and the Environment in Beijing, Using PM2.5 Concentrations
point is reached at 15,272 CNY (2009 Q4) per
quarter or 60,000 CNY per year and the second
turning point will be reached at 33,500 CNY per
quarter or 132,000 CNY per year. When income
is in the interval of the first and second turning
point, PM2.5 decreases as income grows. From
the second turning point onwards, pollution
starts increasing again as income increases. Per
capita income in Beijing in 2017 Q2, the last
quarter in our dataset was 29,280 CNY a little lower than the income associated with the
second turning point. It suggests that Beijing
will shortly reach the second turning point and
it is possible that the environment will worsen
as income grows, if tailored structural policies
or stricter environmental policies are not implemented.
The negative coefficients of the seasonal variables Q1-Q3 suggests that air quality is worse
(higher PM2.5 concentrations) in Q4, which may
be explained by the start of the winter season in
Beijing and therefore higher use of fossil fuels
(including coal) for central heating. This effect
is also well highlighted in the previous literature
(see He et al., 2002; Duan et al., 2006; Zhao et
al., 2009).
The time trend in all four regressions are
positive, indicating that the pollution will rise
as time goes. The reason for may be due to lowenergy efficiency of the Beijing economy (China
energy development report, 2008) which calls
for urgent energy efficiency reforms.
The coefficients for green space and length
of road network, although insignificant, present
the expected sign (see regressions 1 and 3). The
concentration of PM 2.5 is positively related to
length of road network, suggesting that longer
roads lead to more vehicles and therefore high
er air pollution. The coefficient of green space
is negative and suggests a small reduction in
pollution by a unitary increase in green space.
One potential explanation for these variables
being insignificant is that they are highly correlated to GDP per capita, and GDP per capita is
positively related to air pollution. As shown in
Table E below, Variance Inflation Factors (VIF)
of green space and length of the road network
are greater than 30, suggesting multicollinearity. We therefore proceeded to eliminate those
two variables from regressions 2 and 4 in which
most of the coefficients are significant and of
the correct sign.

6. Discussion and Policy
Implications
In Panayotou (1997) some intuitions are given
for the occurrence of the first turning point.
When income reaches a relatively high level,
consumers’ demand for environmental goods,
such as energy efficient housing and cars, increases. Furthermore, more resources can be
devoted by the government towards environmental protection further decreasing degradation 13.
The Beijing government has placed air pollution control as a priority since 1998, and a variety
of measures has been significantly implemented
ever since. These measures include clean energy promotion, on-road vehicle constraints,
industrial construction upgrading, air quality
monitoring and forecasting system, and education aiming at public awareness of air quality.

13 Panayotou (1997) found that improvements in the quality of
institutions (policies) by 10% will lead to a 15% reduction in
SO2 emissions. Bhattarai and Hammig (2001) found that the
quality of official policies is negatively related to deforestation.

Table C
Different EKC Patterns

Pattern
β1
β2
β3

N shape
>0
<0
>0

inverted N shaped
<0
>0
<0

inverted U shape
>0
<0
Insignificant

U shape
<0
>0
Insignificant

Monotonously increasing
>0
Insignificant
Insignificant

Monotonously decreasing
<0
Insignificant
Insignificant

The Relationship between Growth and the Environment in Beijing, Using PM2.5 Concentrations